
General
Company form: Dairy cooperative
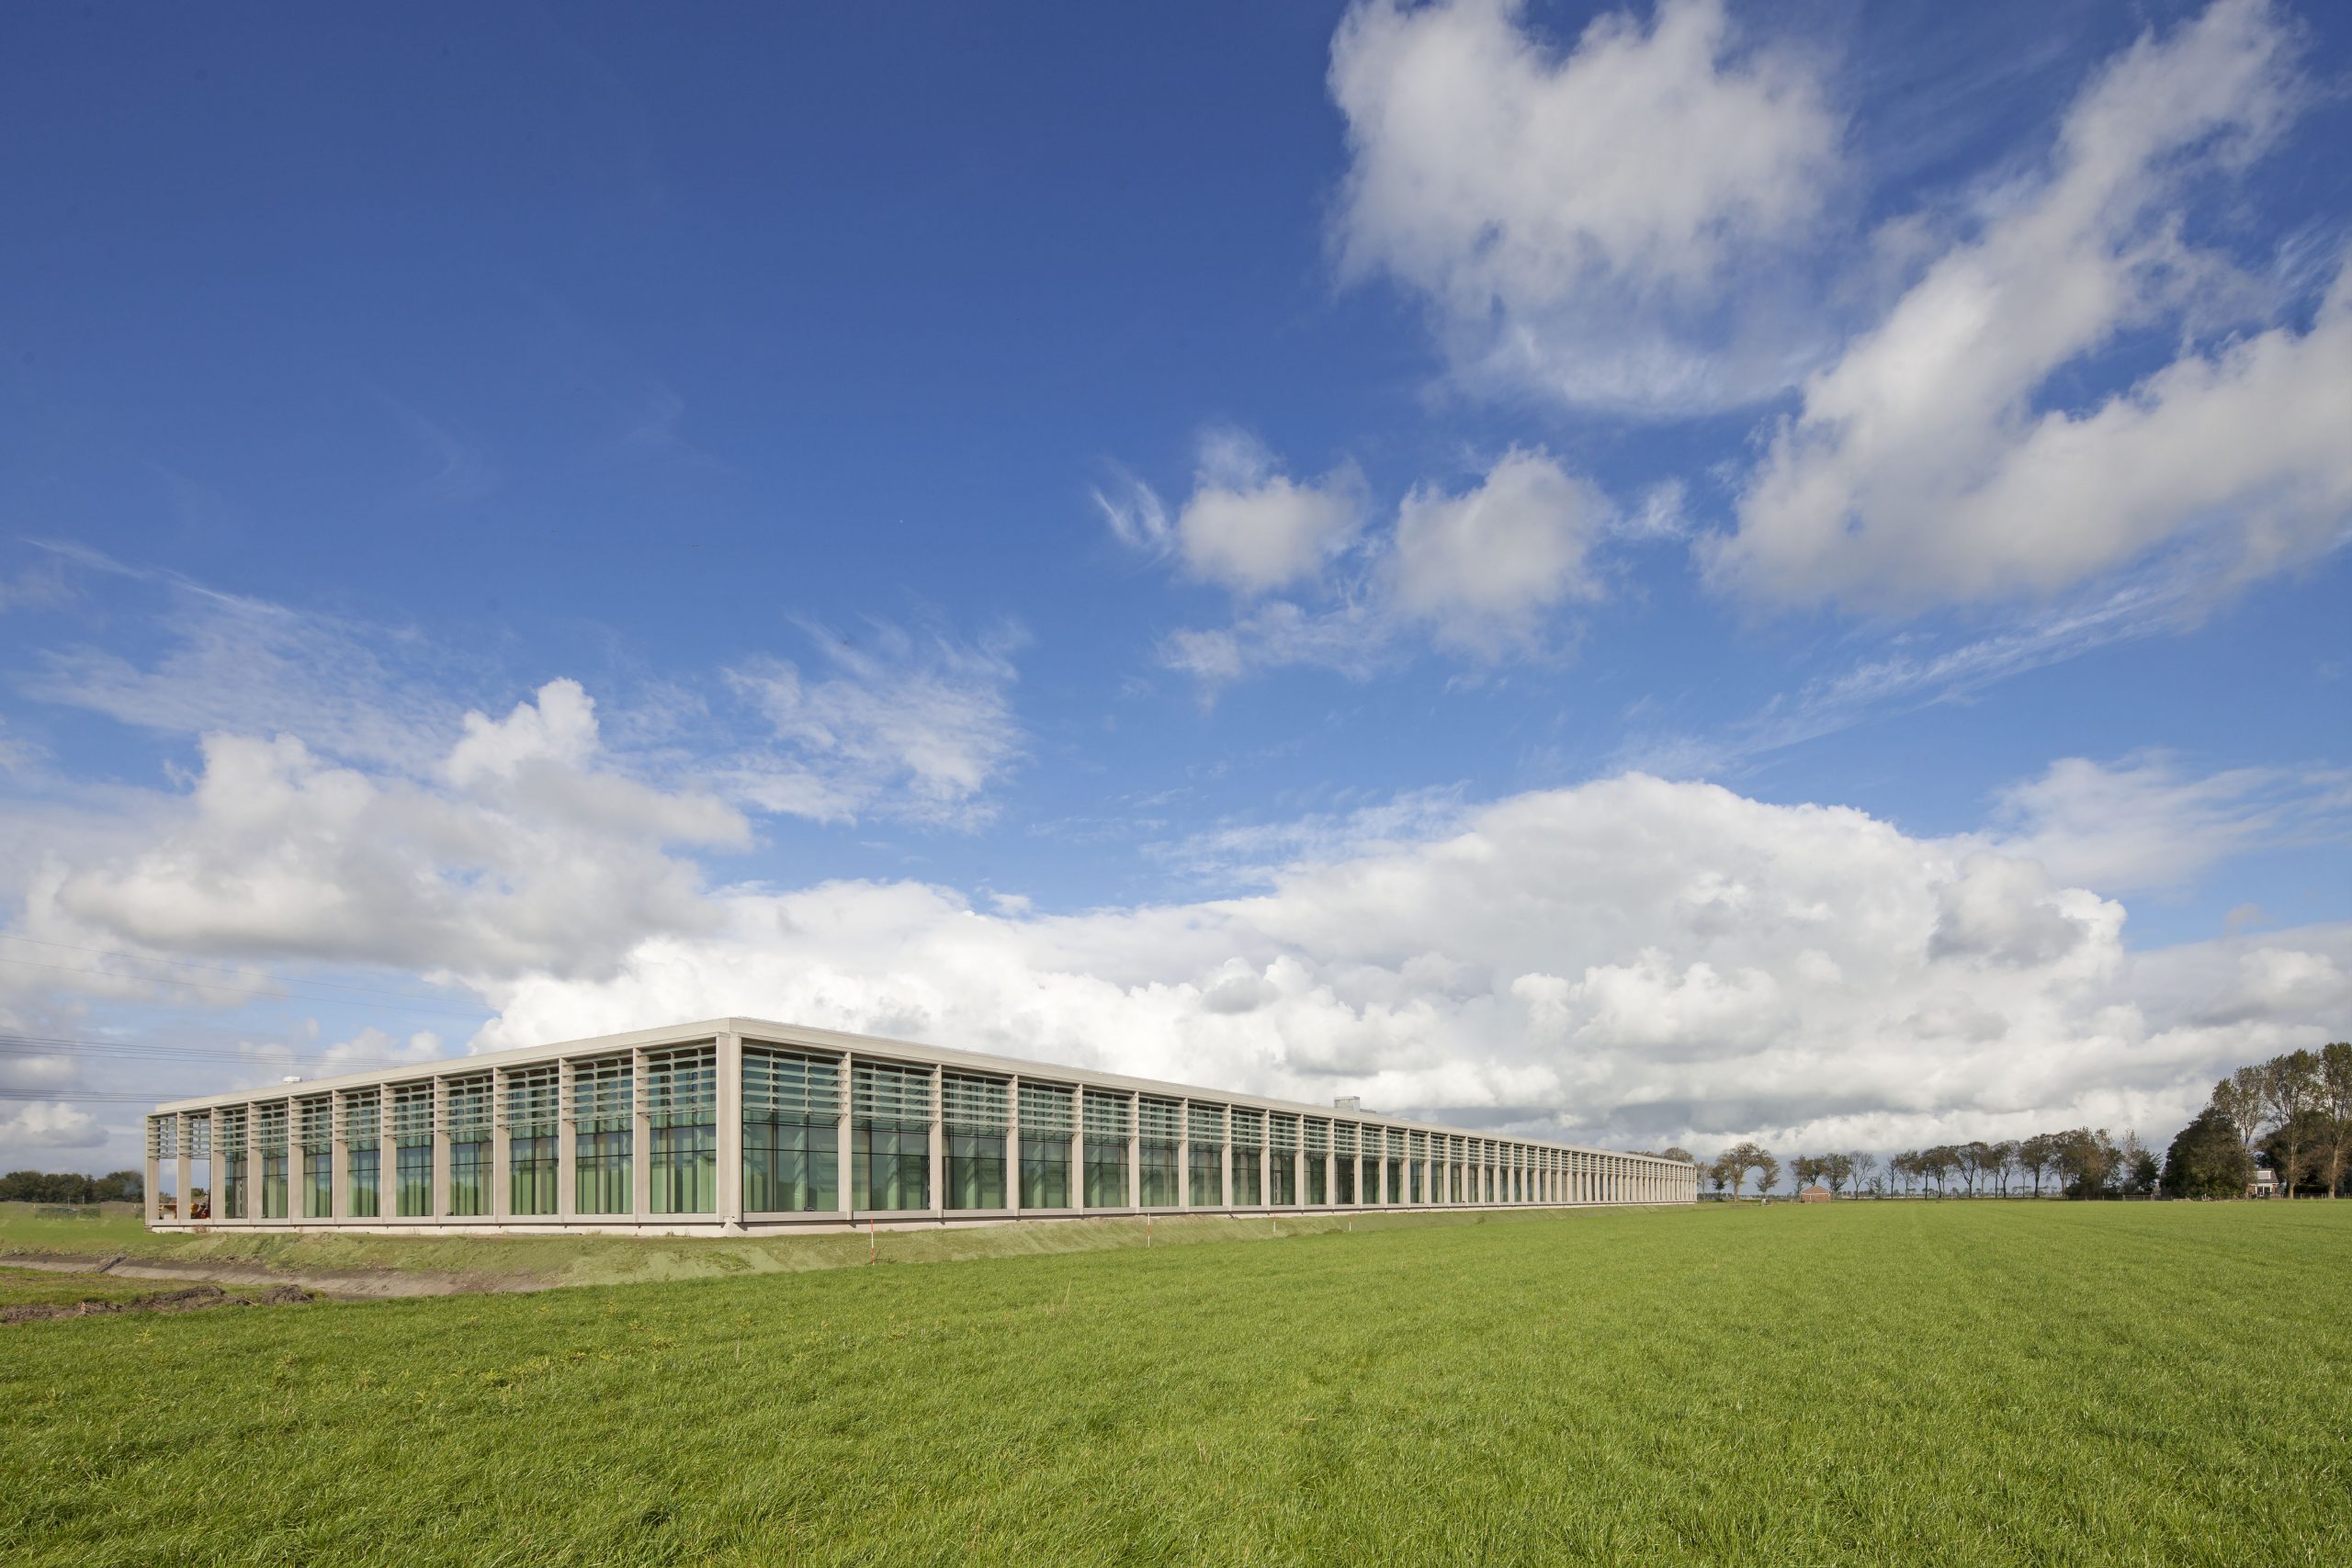
Place of business: Westbeemster
Cash milk price
Annual sales
Milk supply
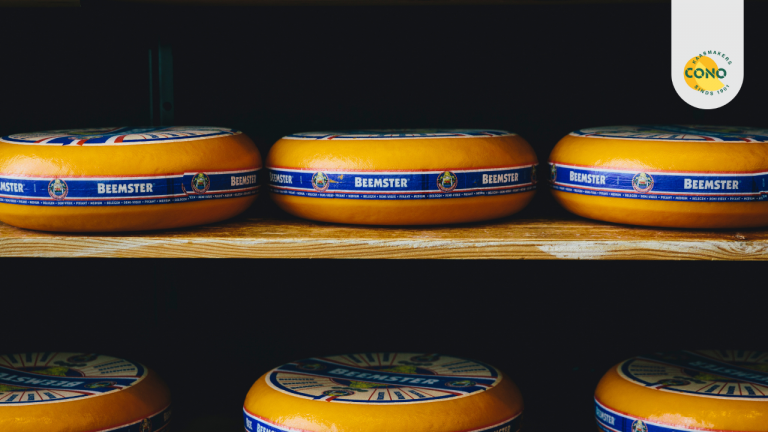
Cheese production
Number of farmers

Number of cheese makers
History
-
2025
Launch renewed Caring Dairy Program
-
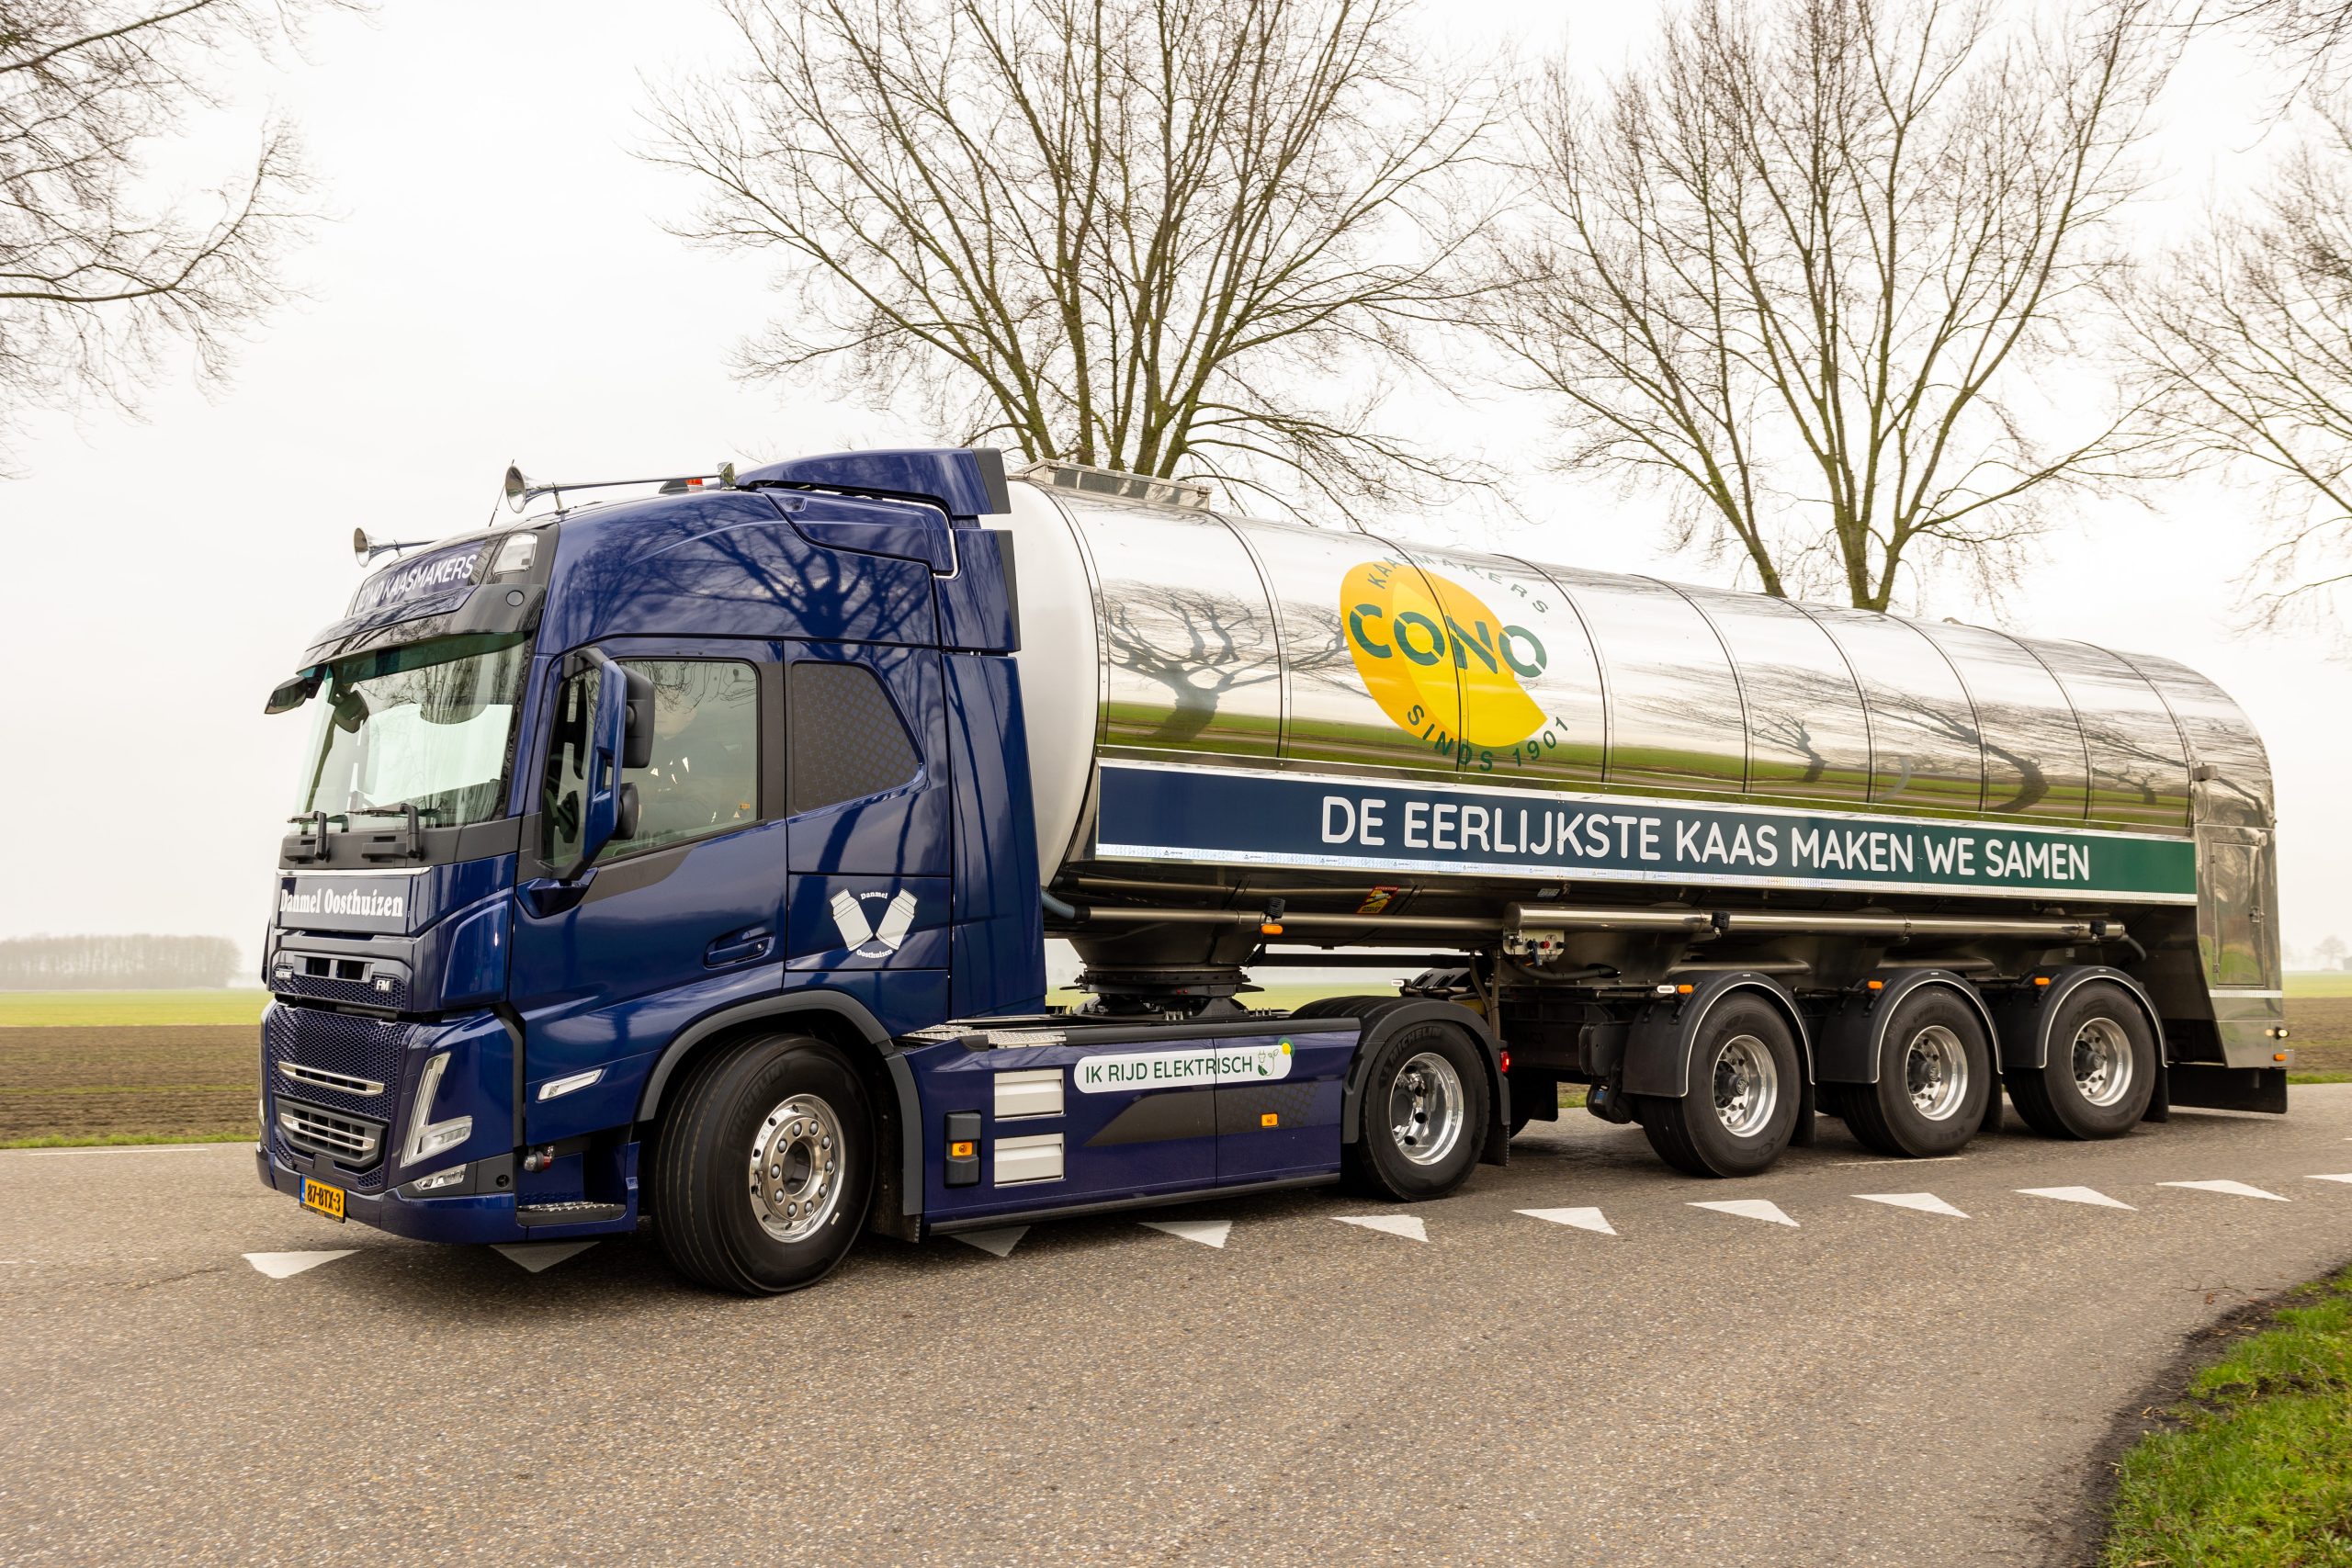
2023
CONO drives the Netherlands' first all-electric RMO.
-
2021
A new sustainability ambition: positive for future generations
-
2021
Most CONO cheeses are vegetarian
-
2020
100% GMO-free milk
-
2016
Closure of old cheese factory
-
2014
Opening new cheese factory
-
2012
Start of construction of new cheese factory
-
2008
Launch sustainability programme Caring Dairy
-
2002
Start of active promotion of outdoor grazing of dairy cows
-
2001
Receipt of the Supplier of the Year predicate
-
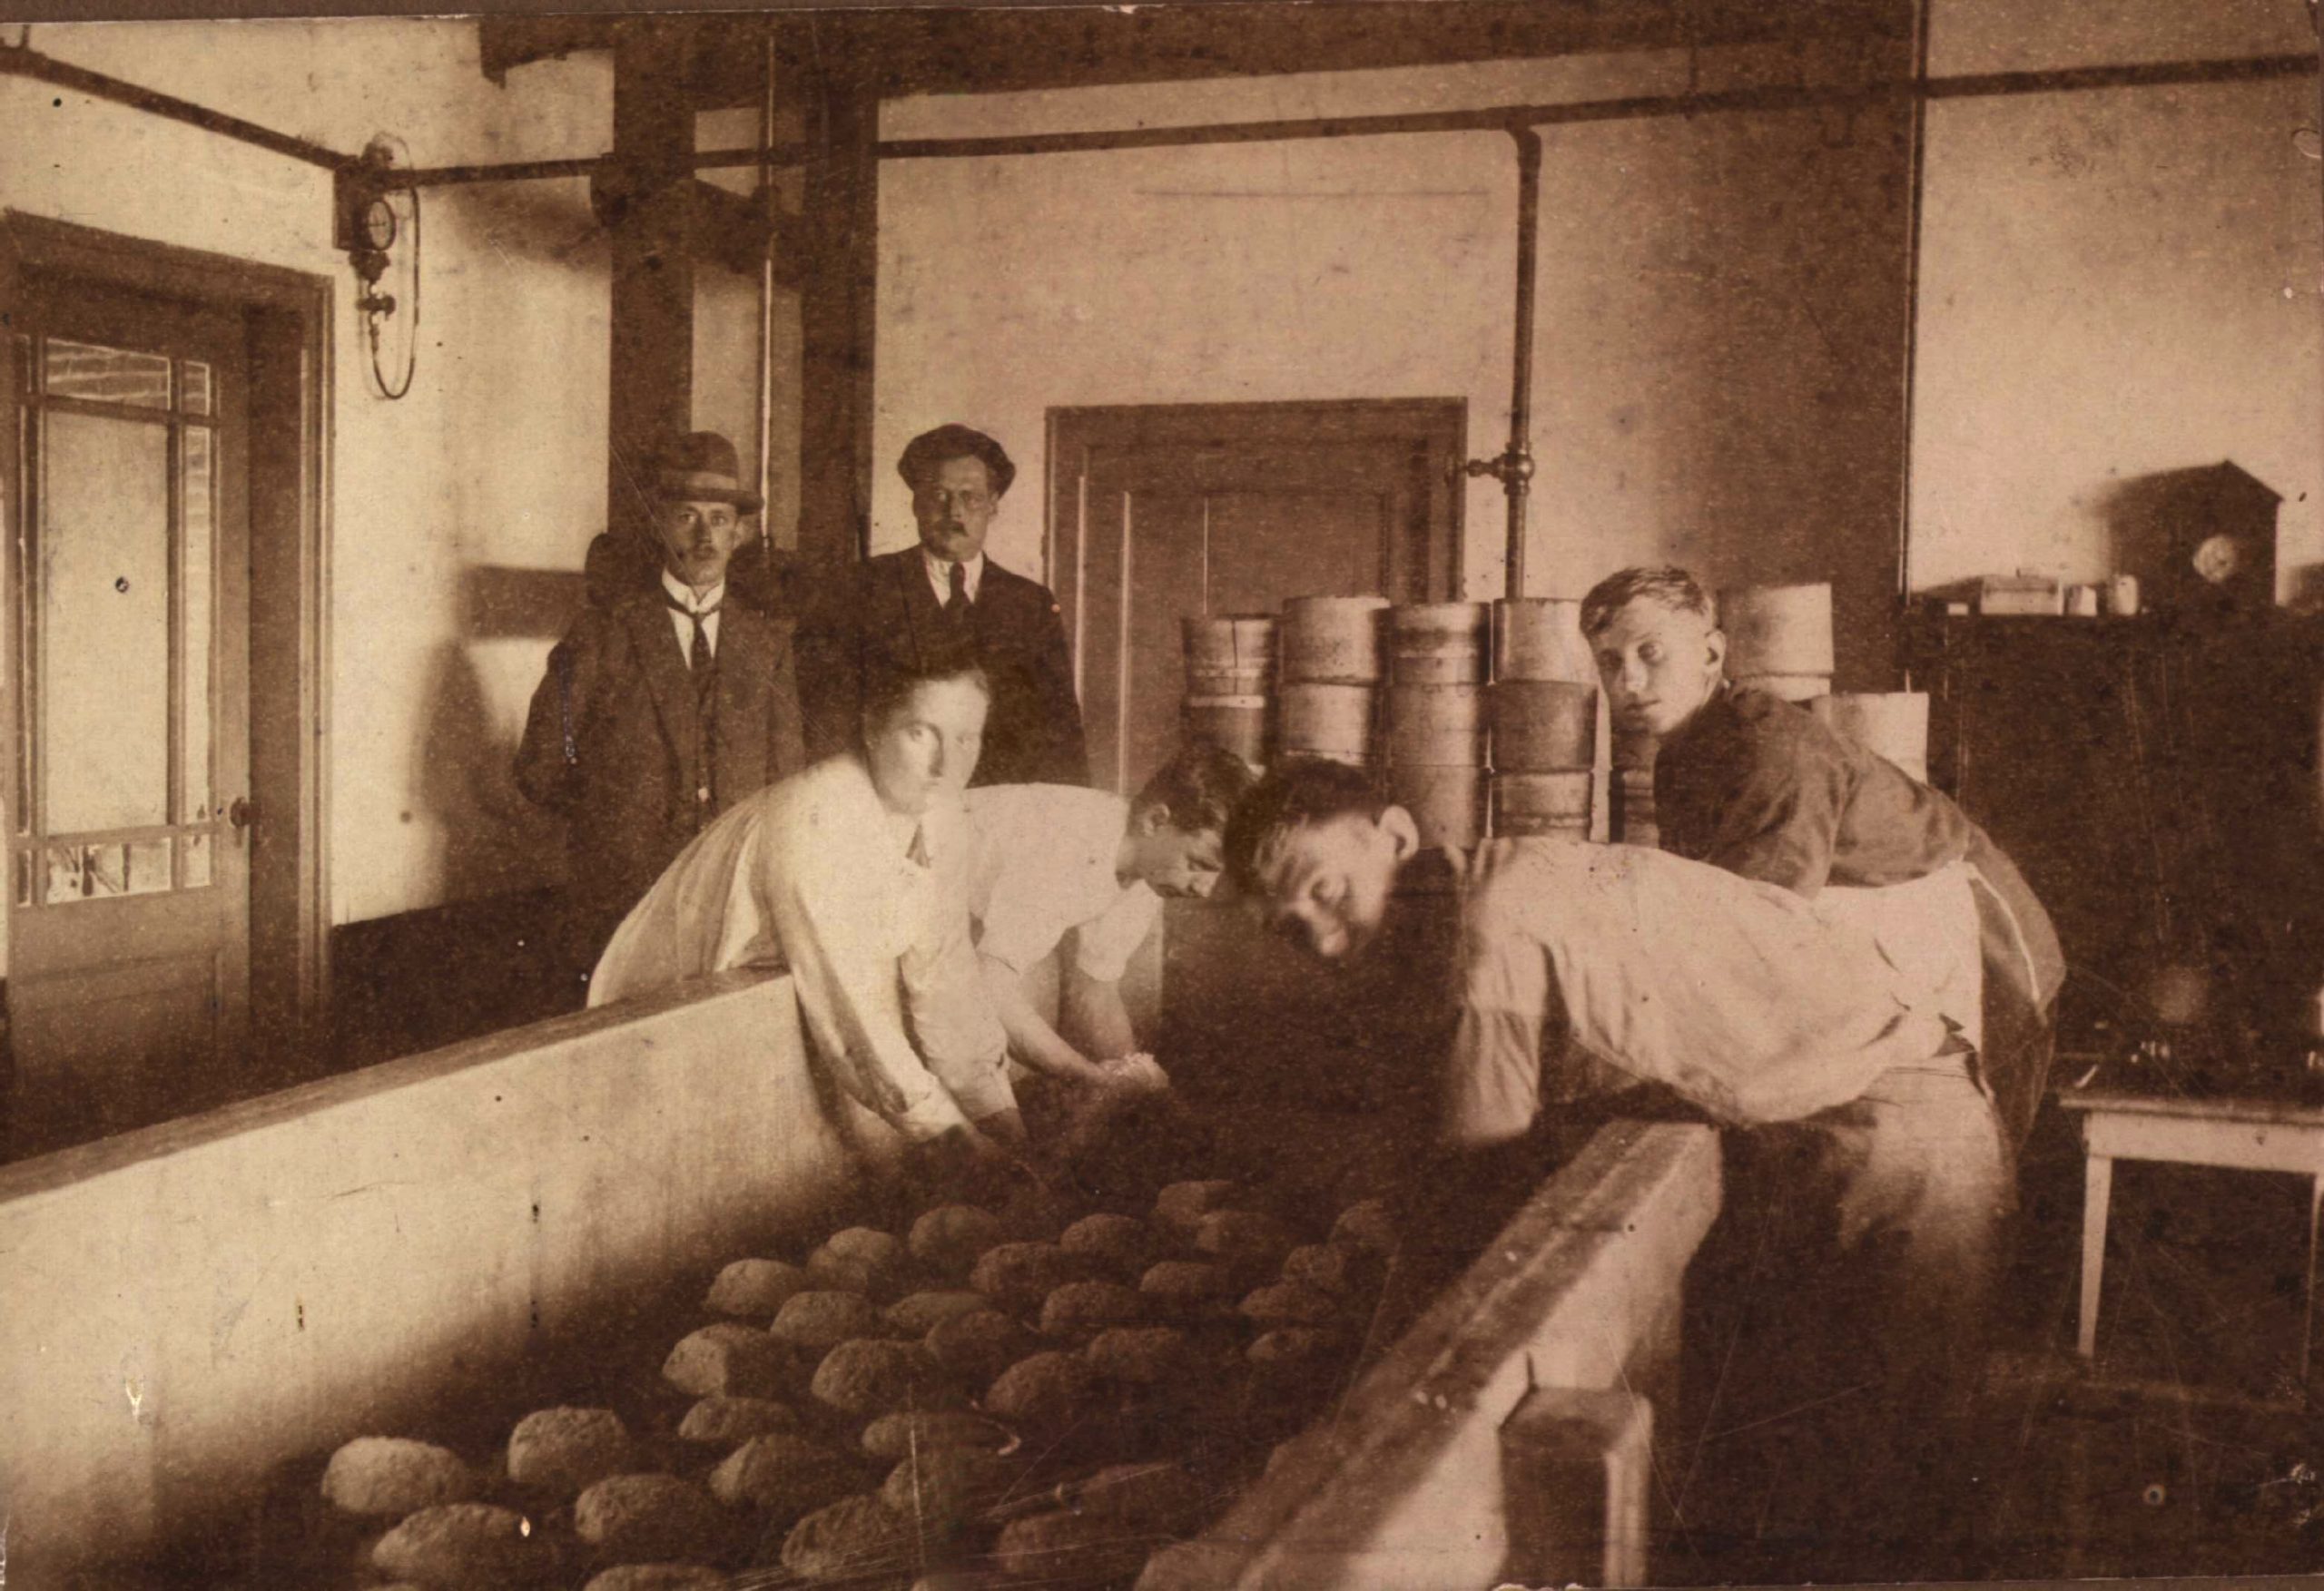
1901
Establishment of cooperative
Prices

General Journal
Beemster Jong best young cheese from supermarket
Best Product of the Year
Beemster Royaal Grand Cru
Gold Partner Award 2025
Beemster Royaal
Superior taste
Beemster Royaal
World Cheese Awards
Beemster 30+ Aged, Beemster Royaal Grand Cru, Beemster X-O-
International Cheese & Dairy Awards
Beemster Royaal, Beemster Royaal Grand Cru
Sustainable Brand Index
Beemster is the most sustainable cheese brand according to consumers
World Cheese Awards 2024
Super gold for Royaal Grand Cru and Beemster old 30+ and gold for Beemster X-O-
Foodpersonality
Captain of the Category - domestic and foreign cheese
DLG Awards
Gold for Beemster X-O-
Foodstuffs newspaper
Best Introduction: Beemster Signature shot pieces
Sustainable Brand Index
Sixth year in a row: Most sustainable cheese brand according to Dutch consumers
Milk Milk and more milk
A fair milk price so farmers can produce the very best milk
CONO Kaasmakers set the cash milk price for 2023 at €47.29 per 100 kilograms.
Our dairy farmers' cows spend an average of 175 days a year*, over 10 hours a day in the pasture. All our cheeses are made from 100% pasture-raised milk.
Of the CONO dairy farmers, 97% meet the national grazing standard.
Our milk is 100% GMO-free.
*grazing result 2024
Caring Dairy objectives and results
The tables below show the goals and results achieved. The goal is an average for the entire cooperative. Each company can make further sustainability improvements based on its own vision and operations, so there will always be variation between companies.
| CARING DAIRY THEME 'HAPPY COWS | ||||||||||
|---|---|---|---|---|---|---|---|---|---|---|
| Happy cows | Objective | Results | ||||||||
| Indicator | until 2025 | 2017 | 2018 | 2019 | 2020 | 2021 | 2022 | 2023 | 2024 | |
| 1. Dairy cattle grazing | ≥ 180 days OR | Number of days | 175 | 194 | 182 | 185 | 180 | 191 | 176 | 175 |
| ≥ 1440 hours | Number of hours | 1836 | 2074 | 1914 | 1907 | 1891 | 1959 | 1794 | 1831 | |
| 2. Grazing young cattle | ≥ 120 days | Number of days | 169 | 173 | 162 | 177 | 175 | 172 | ||
| 3. Closed company | No supply of cattle | % closed companies | 56 | 61 | 63 | 70 | 71 | 68 | ||
| 4. Healthy calves | ≤ 15% calf mortality | % calf mortality | 13 | 12 | 10,53 | 10,19 | 9,22 | 8,83 | 8,89 | 9,43* |
| 5. Lifetime | ≥ 6 years | Number of days | 2096 | 2078 | 2095 | 2185 | 2256 | 2290 | 2314 | 2292 |
| Number of years | (5 years, 9 months) | (5 years, 8 months) | (5 years, 9 months) | (almost 6 years) | (6 years, 2 months) | (6 years, 3 months) | (6 years, 4 months) | (6 years, 3mnd) | ||
| 6. Veterinary medicines | ≤ 2 animal day dosage | Animal daily dose | 2,16 | 2,02 | 2,04 | 2,19 | 2,17 | 2,09 | 2,18 | 2,13 |
| CARING DAIRY THEME 'MORE GRASS & BIODIVERSITY | ||||||||||
|---|---|---|---|---|---|---|---|---|---|---|
| More grass & biodiversity | Objective | Results | ||||||||
| Indicator | until 2025 | 2017 | 2018 | 2019 | 2020 | 2021 | 2022 | 2023 | 2024 | |
| 7. Grass in rations | ≥ 15% fresh grass OR | Fresh grass in ration (% dry matter) | 15 | 17 | 17 | 18 | 18 | 18 | 17 | 17 |
| ≥ 60% incl grass silage | Total grass in rations (% dry matter) | 58 | 58 | 59 | 59 | 60 | 60 | 59 | 57 | |
| 8. Homegrown protein | ≥ 65% | % own protein | 69 | 65 | 73 | 70 | 64* | 61* | 62* | 61* |
| 9. Concentrates and by-products | The concentrate ration is ≤ 25 kg/100 kg of milk AND | Kg concentrate / 100 kg milk | 28,5 | 26,5* | 22,3* | 22 | 22,2 | 22,6 | 22,5 | 23,9 |
| Concentrates including by-products (in kg dry matter) ≤ 30 kg/100 kg of milk measured | Kg concentrate + by-products / 100 kg milk | 29,6* | 26,8* | 26,7 | 25,8 | 26,8 | 26,5 | 28,1 | ||
| 10. Agricultural nature management | ≥ 5% of the area | % farms with >5% agricultural nature | 45 | 50 | 51 | 46 | 52 | 48 | 48 | 56 |
| Area of agricultural nature of the above mentioned group (%) | 26 | 27,8 | 29 | 29 | 26 | 27 | 28 | 31 | ||
| 11. Perennial grassland | ≥ 50% of the area | % permanent pasture | 57 | 60 | 61 | 61 | 62 | 61 | 60 | |
| * Modified calculation system |
| CARING DAIRY THEME 'BETTER ENVIRONMENT & CLIMATE | ||||||||||
|---|---|---|---|---|---|---|---|---|---|---|
| Better environment & climate | Objective | Results | ||||||||
| Indicator | until 2025 | 2017 | 2018 | 2019 | 2020 | 2021 | 2022 | 2023 | 2024 | |
| 12. Green power and low energy consumption | 100% green power and ≤6 kWh/100kg of measured milk | Power consumption (kWh/100kg milk) | 5,5 | 5,1 | 5,4 | 4,8 | 5,1 | 5,0 | 4,8 | 4,9 |
| % of companies purchasing green energy | 46 | 56 | 73 | 80 | 82 | 89 | 90 | 93 | ||
| 13. Own energy | ≥ 25% of electricity relative to total electricity consumption is generated on the farm itself. generated on the farm. | % of companies with energy generation | 24 | 26 | 34 | 38 | 44 | 53 | 63 | 68 |
| % own energy vs. electricity consumption | 17 | 18 | 22 | 27 | 30 | 40 | 49 | 47 | ||
| 14. Greenhouse gas emissions | ≤120 kg CO2 eq/100 kg measuring milk | CO₂ equivalents / 100 kg milk | 134 | 133 | 134 | 123 | 120 | 119 | 94,6 | 109,9** |
| 15. N soil surplus | ≤ 150kg N/ha | N soil surplus / ha Nitrogen indicator | 144 | 160 | 134 | 152 | 152 | 166 | 123 | 129 |
| 16. Ammonia emissions | ≤ 75kg NH₃/ha | Ammonia / ha Nitrogen indicator | 66 | 64 | 56 | 58 | 51 | 50 | 50 | 48 |
| 17. Crop protection | ≤ 250 environmental impact points | Number of environmental impact points | 38 | 58 | 45 | 133 | 126 | 66 | 50 | 181*** |
| Glyphosate-free | % of farms glyphosate-free | 88 | 91 | 98 | 99 | 100 | 100 | 99 |
| CARING DAIRY THEME 'SOCIAL COMMITMENT | ||||||||
|---|---|---|---|---|---|---|---|---|
| Socially involved | Objective | Results | ||||||
| Indicator | until 2025 | 2019 | 2020 | 2021 | 2022 | 2023 | 2024 | |
| 18. Company is open to society | More than 100 unique visitors per year | Average visitors per company | 226 | 175 | 249 | 369 | 420 | 337 |
| Share of companies with a social side branch (%) | 10,3 | 29,8 | 34,9 | 31,4 | 28,4 | 34,72 |
* Effect blue tongue
** Results are strongly influenced by agents that had low environmental impact points in the past but very high points since 2024. This follows a new assessment by EFSA. In 2025, these agents should no longer be used.
*** Modified calculation system KringloopWijzer